
大作文汇总
考研英语二大作文汇总,正在更新
2010年英二图表作文
Directions
In this section, you are asked to write an essay based on the following chart. In your writing, you should
- interpret the chart, and
- give your comments.
You should write at least 150 words. Write your essay on the ANSWER SHEET. (15 points)
Article
feat.
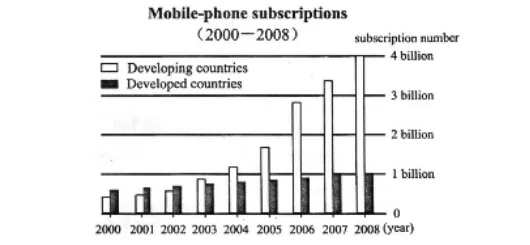
The above bar chart clearly reveals the markedly different growth rates of cell phone subscriptions between wealthy nations and emerging economies. As is shown in the chart, the number of handset subscribers in advanced countries experienced a steady and slight increase from 2000 to 2007 and remained constant since then. In sharp contrast, there was a progressive rise in the number of wireless phone users in developing world from 2000 to 2004, followed by a steep growth from 2004 to 2008.
上图中的柱状图清楚地显示了发达国家与新兴经济体在手机用户数量增长率上的显著差异。如图所示,2000年至2007年间,发达国家的手机用户数量呈现稳定且小幅增长的态势,此后则保持平稳。与此形成鲜明对比的是,发展中国家的手机用户数量在2000年至2004年间呈渐进式增长,随后在2004年至2008年间出现了急剧增长。
This trend rests with a host of contributing forces. For one thing, rich countries are typically in possession of sophisticated technologies, empowering them to popularize cellular phones first. However,thanks to the sharing of cutting-edge technologies and the huge improvement in people’s living standards, growing numbers of individuals in less developed areas are capable of employing various hand-held phones conveniently. For another, industrial nations have a relatively sparse population while the bulk of underdeveloped countries are populous. Therefore,the handset market in affluent nations is quite mature after many years of growth. But with the slipping prices of mobile phones, the majority of folks in developing countries have access to this service.
这一趋势源于多种因素的共同作用。一方面,富裕国家通常拥有先进的技术,这使它们能够率先普及手机。然而,得益于尖端技术的共享以及人民生活水平的显著提高,越来越多的欠发达地区居民能够方便地使用各种手机。另一方面,工业化国家的人口密度相对较低,而大多数欠发达国家则人口稠密。因此,经过多年的发展,富裕国家的手机市场已相当成熟。但随着手机价格的不断下降,发展中国家的大多数民众也能够使用这项服务。
As is discussed above, it is not surprising to cast a glance over this chart again. And it can be concluded that developing countries are quickly catching up with developed nations in science and technology. This tide, in my eyes, is tremendously beneficial to bridging the gap between them in many spheres.
正如上文所述,再次审视这张图表并不令人意外。由此可以得出结论:发展中国家正在科技领域迅速赶上发达国家。在我看来,这一趋势对于弥合双方在许多领域的差距大有裨益。
2011 年英二 图表作文
Directions
Write an essay based on the following chart. In your writing, you should
- interpret the chart and
- give your comments. You should write at least 150 words. Write your essay on ANSWER SHEET. (15 points)
Article
feat.
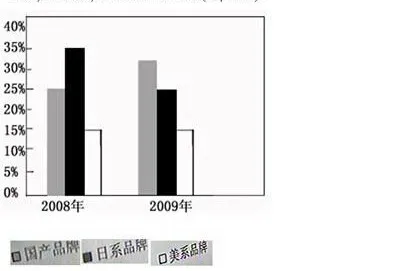
The bar chart above demonstrates clearly that some changes have taken place in terms of the car market in China. Based upon the data of the chart, it can be seen that the sales percentage of domestic cars was on arise, while the percentage of cars made in Japan witnessed a decline. In the year of 2008, the market share of the Chinese cars was nearly 25%, while within no more than a year, it went up to nearly 33%. The Japanese cars occupied 35% of China’s car market in 2008, while the percentage went down to 25% in 2009.
上图的柱状图清楚地表明,中国汽车市场已发生了一些变化。根据图表数据可以看出,国产车的销量占比呈上升趋势,而日本产车的销量占比则出现下滑。2008年,国产车的市场份额接近25%,而在不到一年的时间里,这一比例上升至近33%。2008年,日系车在中国汽车市场的份额为35%,而到2009年,这一比例下降至25%。
It’s of no difficulty for us to come up with some possible factors to account for this trend. At the top of the list, with the rapid development of economy and society, more and more people prefer domestic products to foreign ones. It is reported that approximately 55% of families in Chinese big cities are fond of cars made in China. In addition, we must admit that the government has made great efforts to appeal to us to support our native industries. Last but not least, the fact cannot be ignored that the cars made in China are increasingly having better quality.
要找出导致这一趋势的可能因素并不难。首要原因是,随着经济和社会的快速发展,越来越多的人更倾向于选择国产产品而非进口产品。据报道,中国大城市中约有55%的家庭青睐国产汽车。此外,我们必须承认,政府为呼吁民众支持本土产业付出了巨大努力。最后但同样重要的是,中国产汽车的质量正日益提升这一事实不容忽视。
Taking into account what has been agreed on, we can come to the conclusion that this established trend is positive and therefore acceptable. And I’m firmly certain that this trend will continue in the years to come.
综合上述共识,我们可以得出结论:这一已形成的趋势是积极的,因此值得肯定。我坚信,这一趋势在未来几年内将会持续下去。
2012年英二图表作文
Directions
Write an essay based on the following table. In your writing you should
- describe the table and
- give your comments. You should write at least 150 words. Write your essay on ANSWER SHEET. (15 points)
某公司员工工作满意度调查
| 满意度年龄组 | 满意 | 不清楚 | 不满意 |
|---|---|---|---|
| 小于或等于40岁 | 16.7% | 50.0% | 33.3% |
| 41~50岁 | 0 | 36.0% | 64.0% |
| 大于50岁 | 40.0% | 50.0% | 10.0% |
Article
By drawing this table, the author intends to visually reveal the results of a recently-conducted survey with respect to the employment satisfaction of staff among three age groups. As is shown in the above table,only 16.7% of employees aged 40 and under are satisfied with their work. In the group aged between 41 and50, all the workers either harbor unclear views or feel dissatisfied with their jobs. In the over-50 agecategory, staff who are content constitute a larger proportion than that of another two groups, accounting for 40.0%.
Job satisfaction refers to the degree of pleasure employees can feel when working. And the disparity presented in the table can be boiled down to their different attitudes. As to the employees aged 40 or under,they have not yet cultivated a sense of identity about their posts, or failed to gain job continuity and security.In terms of those middle-aged workers, unfavorable reality has piled up enormous pressure on them. Theyhave to assume the responsibility to feed the whole family, both the children and the elderly. Therefore, they cannot derive much gratification from their positions. For those senior workers, they have created a positiveself-image and nurtured an optimistic outlook about life or work, and more importantly, their contribution shave been valued and appreciated. Thus, they are much more inclined to obtain a higher level of jobsatisfaction.
Employment satisfaction is of broad interest to employers owing to its potential impacts on productivity and morale of employees. Therefore, it is fairly advisable for employers to frame a string of policies to satisfy the reasonable needs of employees and mobilize their enthusiasm,which is undoubtedly hugely rewarding for the long-term and sustainable development of businesses.
2013年英二图表作文
Directions
Write an essay based on the following chart in your writing, you should
- interpret the chart, and
- give your comments You should write about 150 words on the ANSWER SHEET . (15 points)
Article
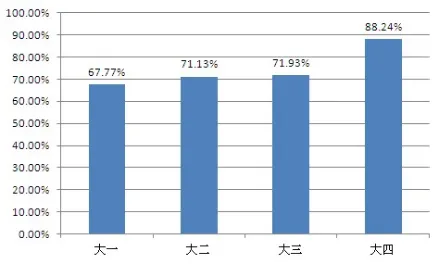
Currently, a host of college students get involved in part-time jobs in their spare time. As is shown intoday’s bar chart, the proportion of university students engaging in casual work almost remains stable,around 70.00%, from the first year to the third year, while it has experienced a steep rise to 88.24% in thefourth year.
The disparity presented in the chart can be boiled down to a couple of factors. As for the freshmen,sophomores and juniors, they need to cope with the burdensome academic assignments. Therefore, theydon’t have enough disposable time to work part-time. In terms of those seniors, on the one hand, they enjoyrelatively adequate leisure hours to participate in some part-time jobs to broaden their horizons and sharpenvarious skills. And more importantly, on the other hand, a wealth of soon-to-be graduates will seek employment in the increasingly tight job market, and valuable work experience can largely boost their competitive edge over the rivals.
The lack of practice skills is widely seen as a shared weakness for young adults. In my eyes, doing some part-time jobs serves as an effective way to address this long-term problem. Thus, more efforts are in urgentneed to encourage college students to be involved in part-time work reasonably.
2014年英二图表作文
Directions
Write your essay on ANSWER SHEET. (15 points). You should
- interpret the chart, and
- give your comments. You should write about 150 words on the ANSWER SHEET. (15points)
Article
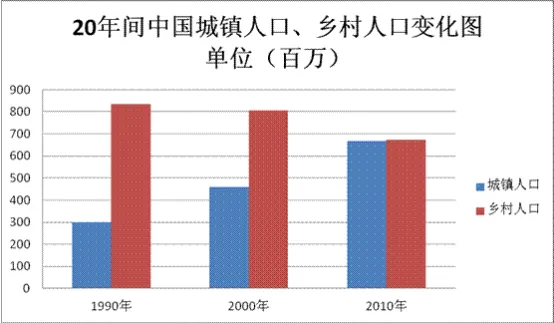
The column chart given above clearly reflects the striking changes between rural and urban population in China from 1990 to 2010. The number of rural residents descended moderately from 820 million to nearly660 million during the two decades. In contrast, the urban population showed a sharp increase from roughly 300 million to 660 million or so in the same span.
It can be concluded that an expanding number of people have left the rural areas and entered cities.What factors exactly contribute to this trend of urbanization? On the one hand, compared with the rural areas,cities enable them to acquire more opportunities for employment and further development. On the other hand, urban areas are superior to rural ones in terms of public services, ranging from infrastructures to education to hospitals, etc.
Given the analyses above, I firmly believe that the trend of urbanization will still continue for quite a while in the years to come. Accordingly, it is advisable for the authorities concerned to put more eyesight onthe problems caused by the population expansion in cities and the population decrease in rural areas. Only by this can we attain a balanced development in both the urban and rural areas.
2015年英二图表作文
Directions
Write an essay based on the following chart. In your writing, your should
- interpret the chart, and
- give your comment. You should write about 150 words on the ANSWER SHEET.
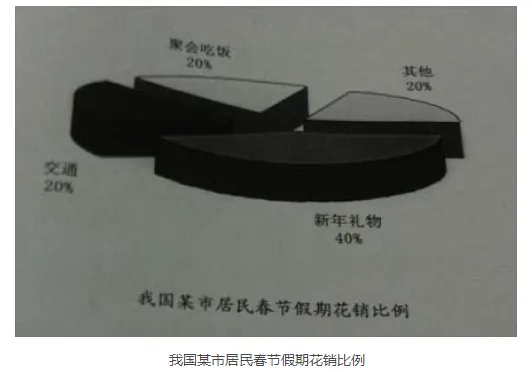
tip:其他不用描述
Article
The pie chart provides some interesting data regarding people’s expenses in a Chinese city during the Spring Festival. To be specific, of all the expenses, money spent on various gifts is at the top of the list,accounting for about 40%. By comparison, those on food and traffic both occupy 20%.
Undoubtedly, the purpose of the chart is to present a phenomenon that people spend more on gifts than on other parts. What exactly contributes to this phenomenon? Personally, there seem to be two elements involved in it. First and foremost, advertisements of mass media, such as radio, television and the Internet,might be misleading. Moreover, our society is sparing no efforts to produce a brand-new concept that one’ssocial status is tightly associated with the gifts sent to others, which can also show his or her wealth.
To sum up, there is an upward tendency for people these days to spend money on festival presents rather than other things, which I believe will not change in a short time. To reverse the trend is not a piece of cake,which requires a good awareness of consumption value and interpersonal communication.
2016年英二图表作文
Directions
Write an essay based on the following chart. In your writing, you should
- interpret the chart, and
- give your comments. You should write about 150 words on the ANSWER SHEET. (15 points)
Article
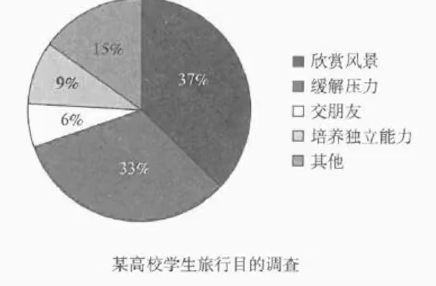
Portrayed in the above pie chart are the investigation results concerning various purposes of travelling among the college students in a certain university. Among them, the most significant ones are to sightseeand relieve stress, which account for 37% and 33% respectively.
The trend revealed in the above chart can get down to two major reasons. To start with, these days some college students don’t content themselves with book knowledge only, and they would consider traveling and sightseeing as an important way to broaden their mind and enrich their soul. In addition, due to the fierce competition of the society, some college students are under great pressure so as to stand out among others. Itturns out that many of them are psychologically bothered. As a therapy, traveling enables students to get away from the pressure and offers them a mental rest and a healthier mental status.
As for me, traveling is of great help for students to relieve stress and acquire a broader perspective of life. As a whole, it is beneficial for us college students to go to see the outside world.